

ASSESSMENT UNAVAILABLE
No England-wide current environmental assessment is published because the governed monitoring coverage and freshness gate was not met.
The station-level PM2.5 operational screen is reported separately and cannot override the governed England-wide coverage/freshness gate.
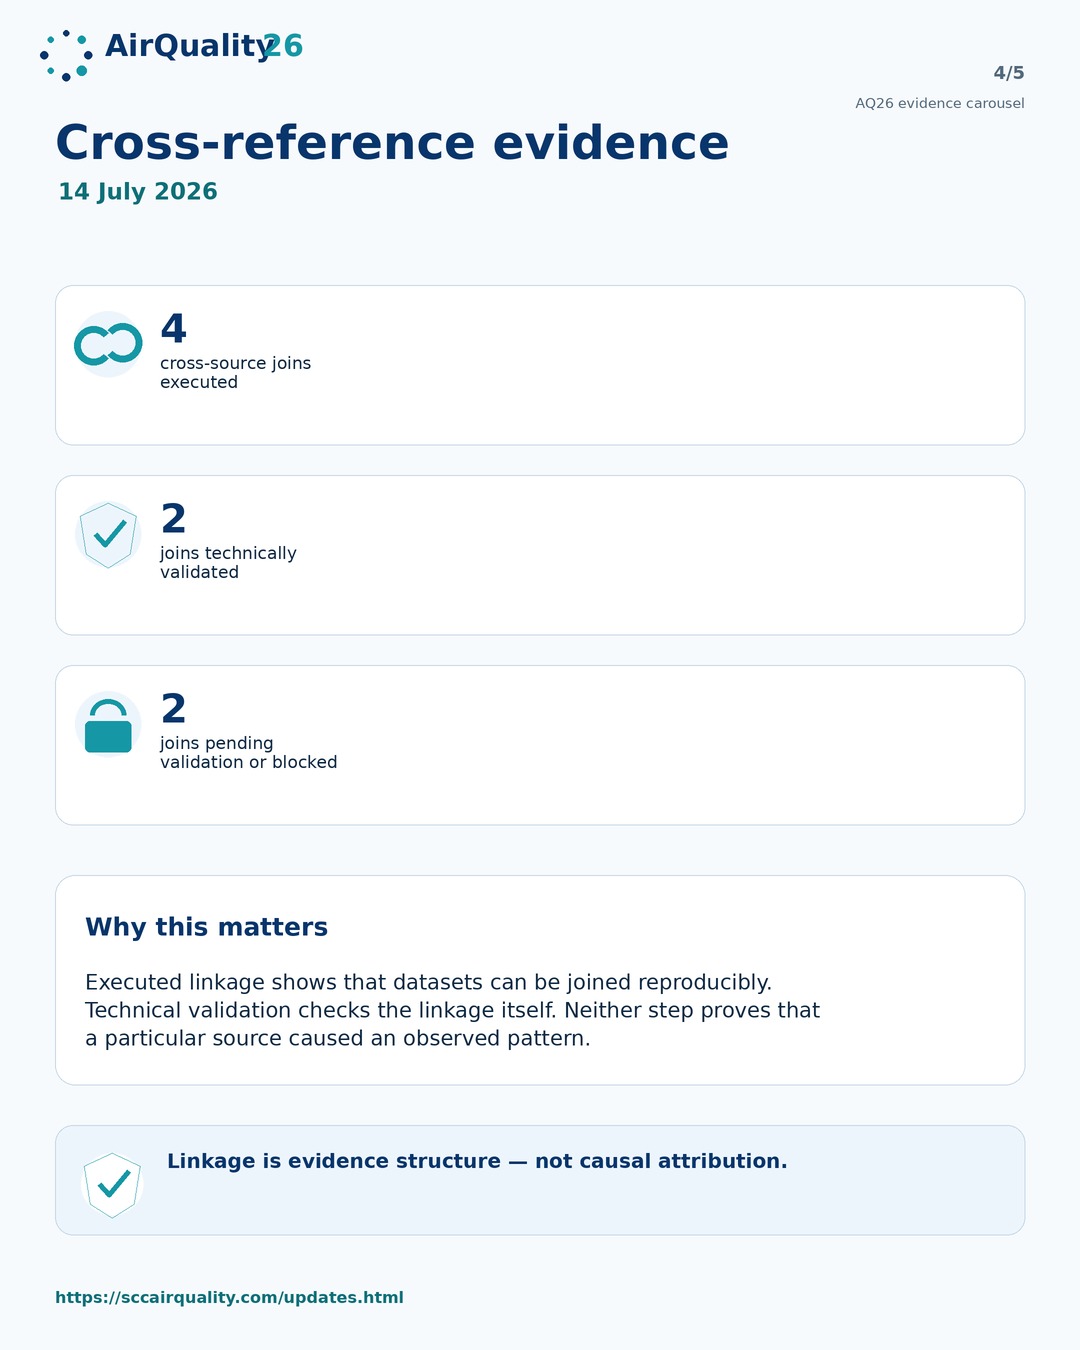
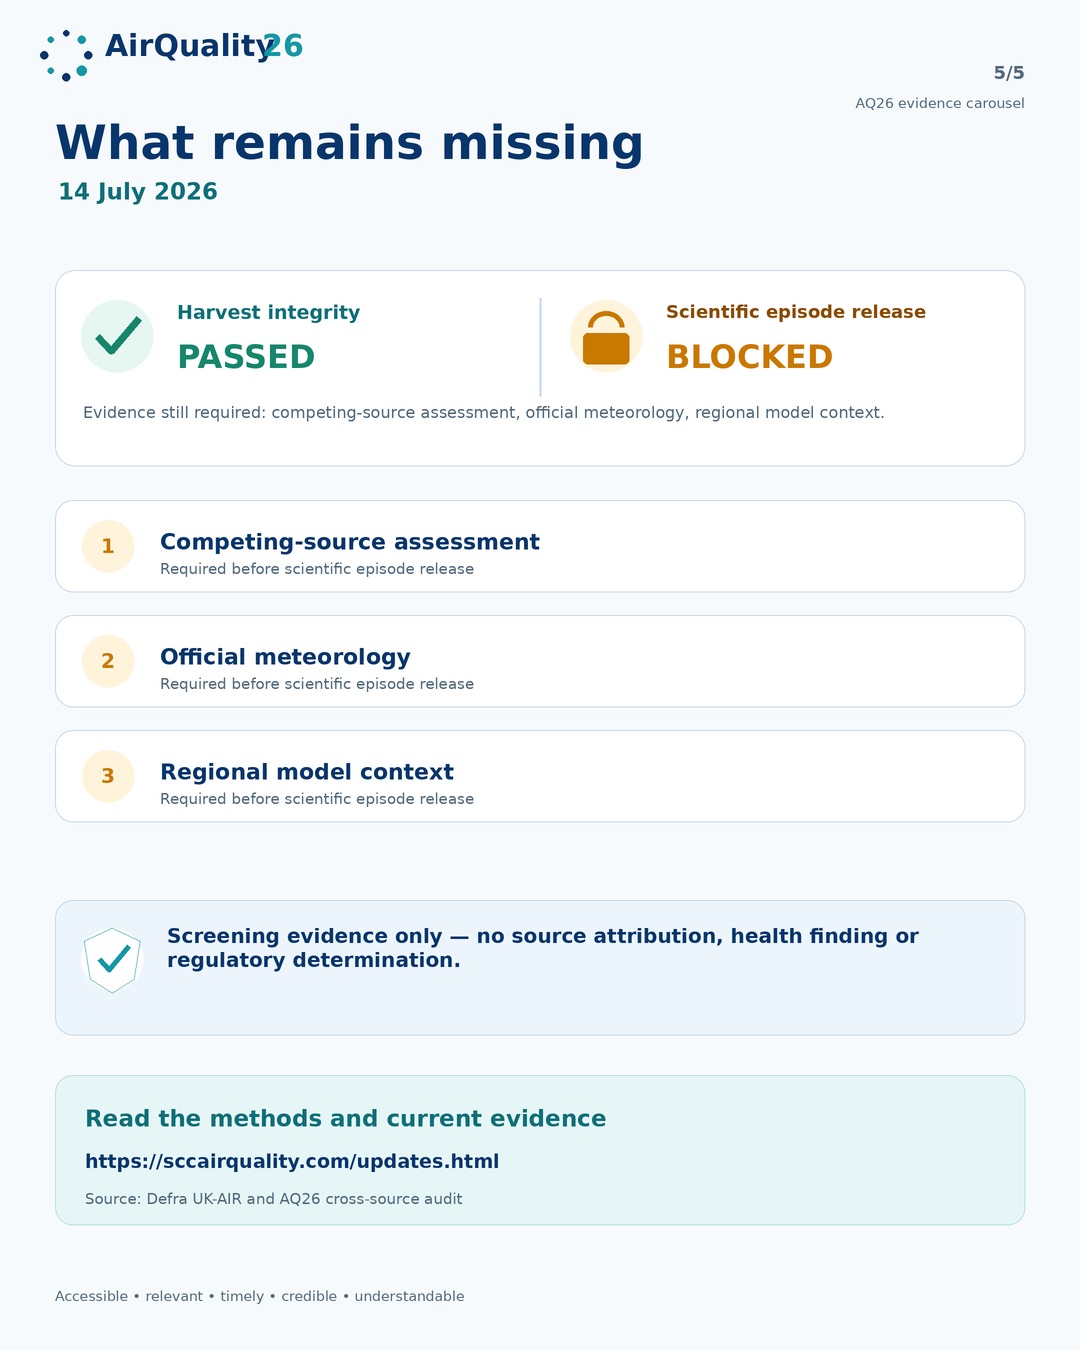
Evidence acquisition: PASSED. 11 configured joins remain pending or blocked. The PM2.5 operational screen and England-wide current assessment are distinct from the 30-day England AURN review. Screening evidence only; no source attribution, legal or health finding.
SCC Air Quality weekly public briefing
Each platform uses the same audited facts, release status, source line and claim boundary. The visual treatment is adapted for Facebook, Instagram and X so the information remains legible and useful in each format.
The graphics are aligned with accessible, relevant, timely, credible and understandable communication principles. They do not claim external approval or endorsement.
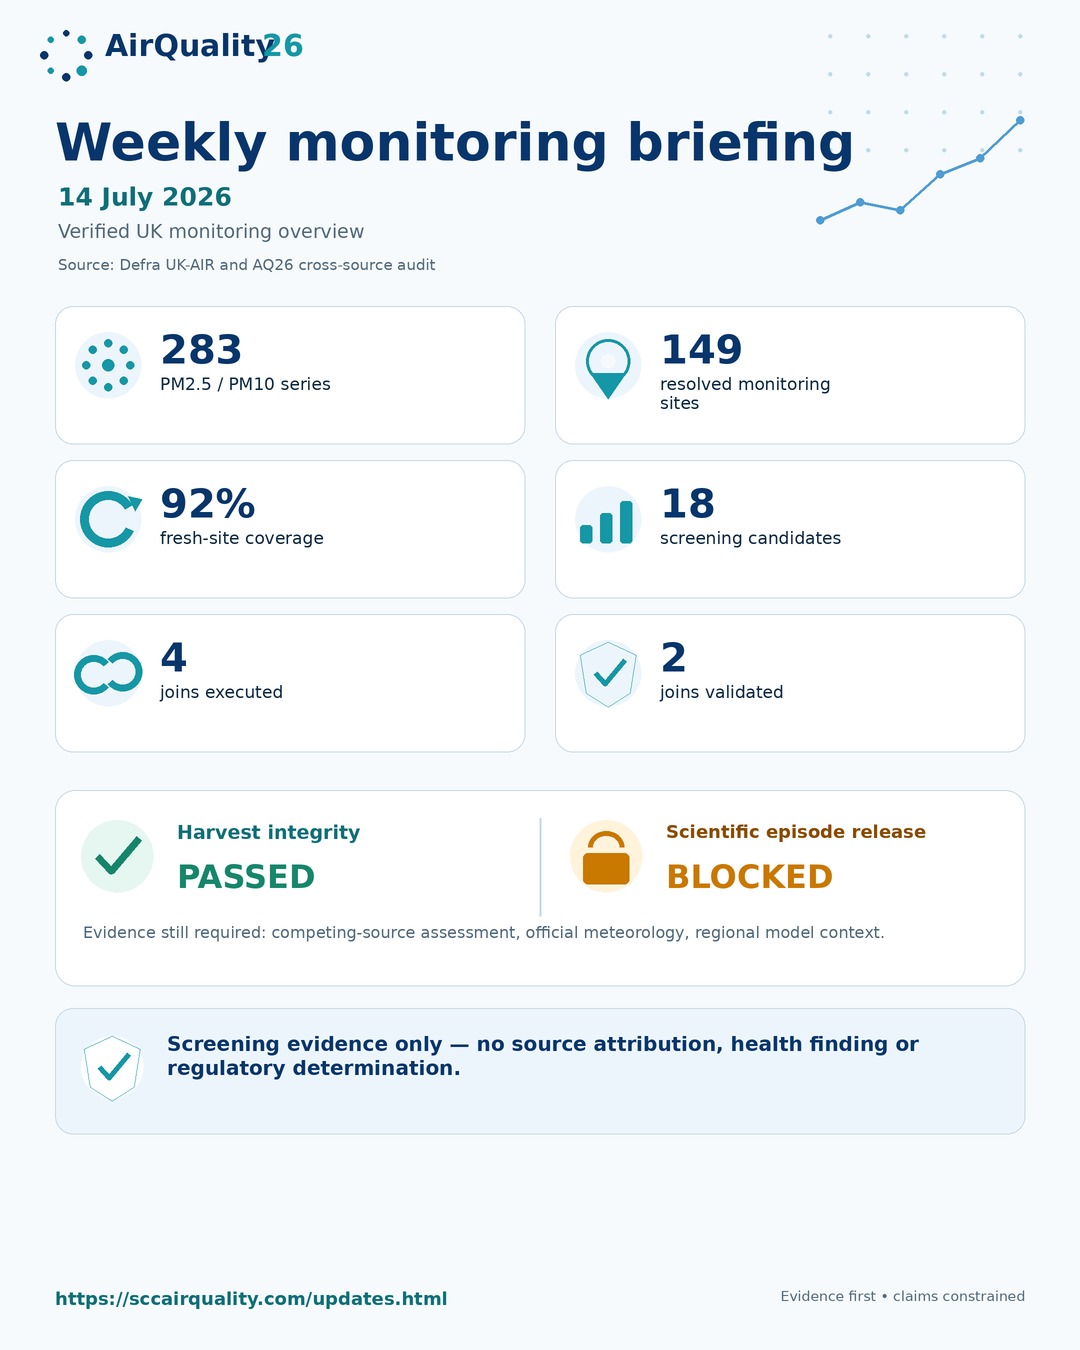
Facebook briefing
A fuller 4:5 institutional summary for readers who want the main metrics and limitations in one frame.
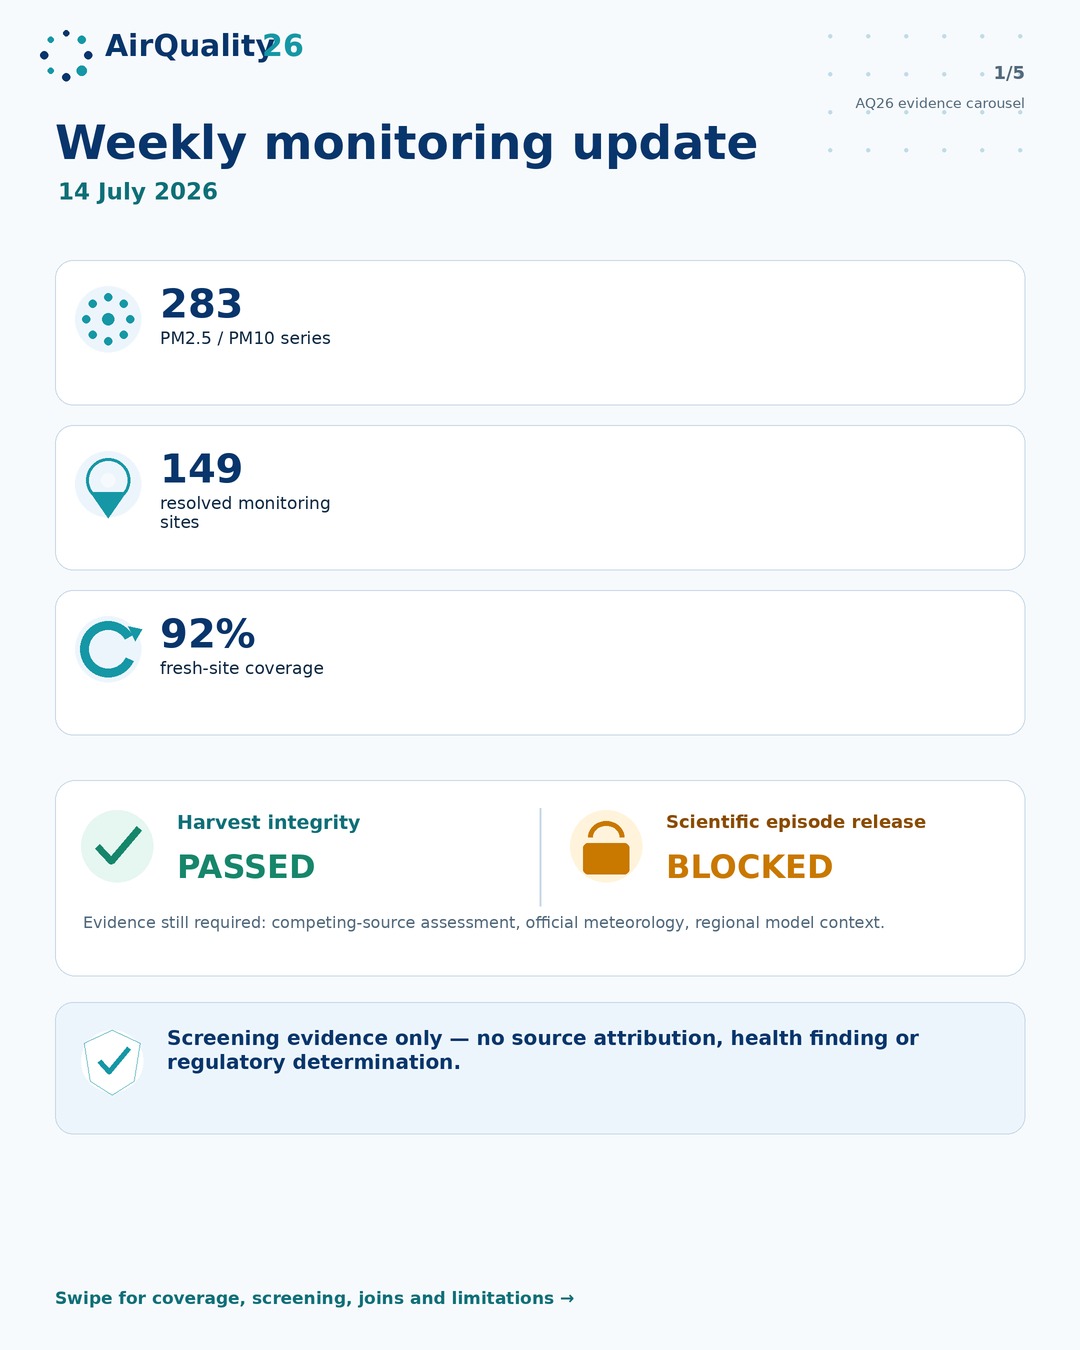
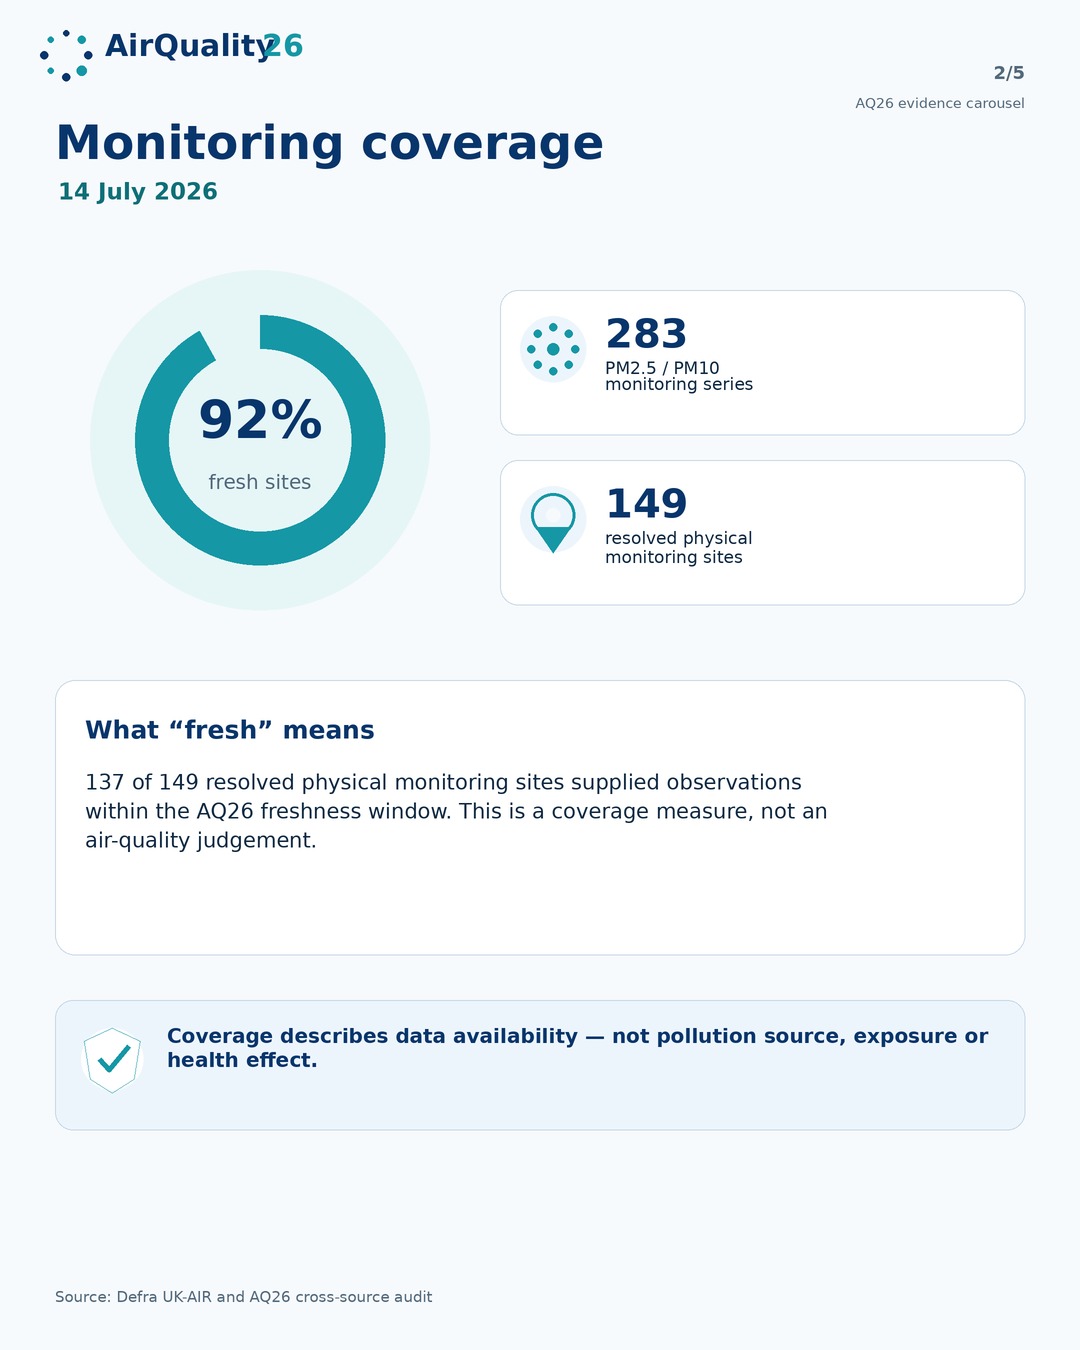
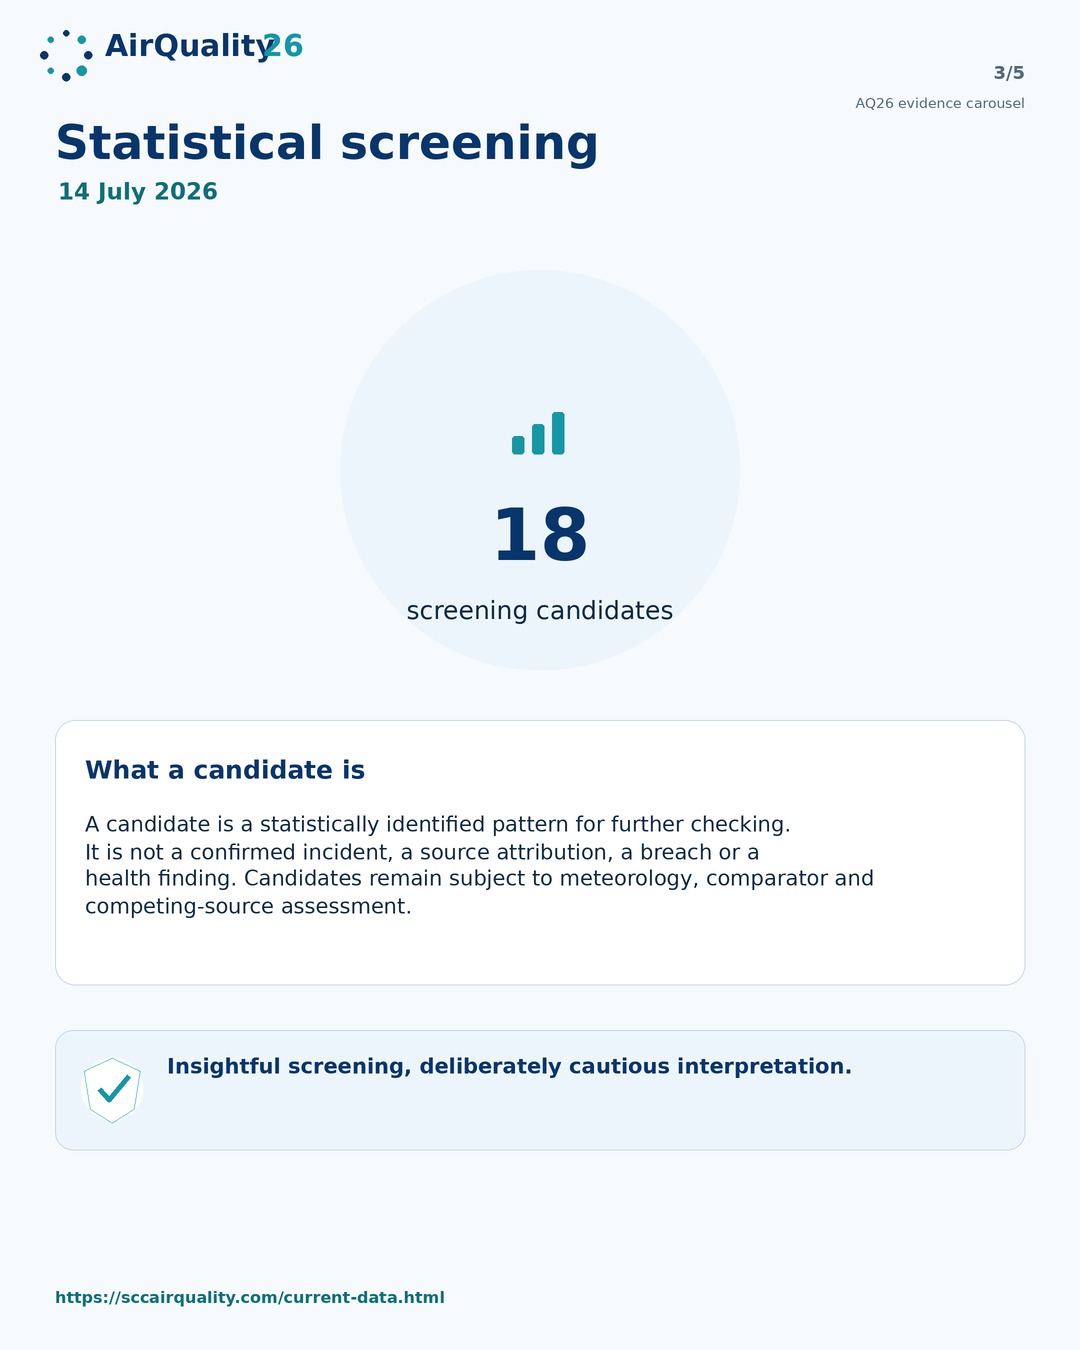
Instagram evidence carousel
Five 4:5 slides covering the daily evidence status, monitoring coverage, statistical screening, cross-reference execution and remaining evidence gaps.
X concise briefing
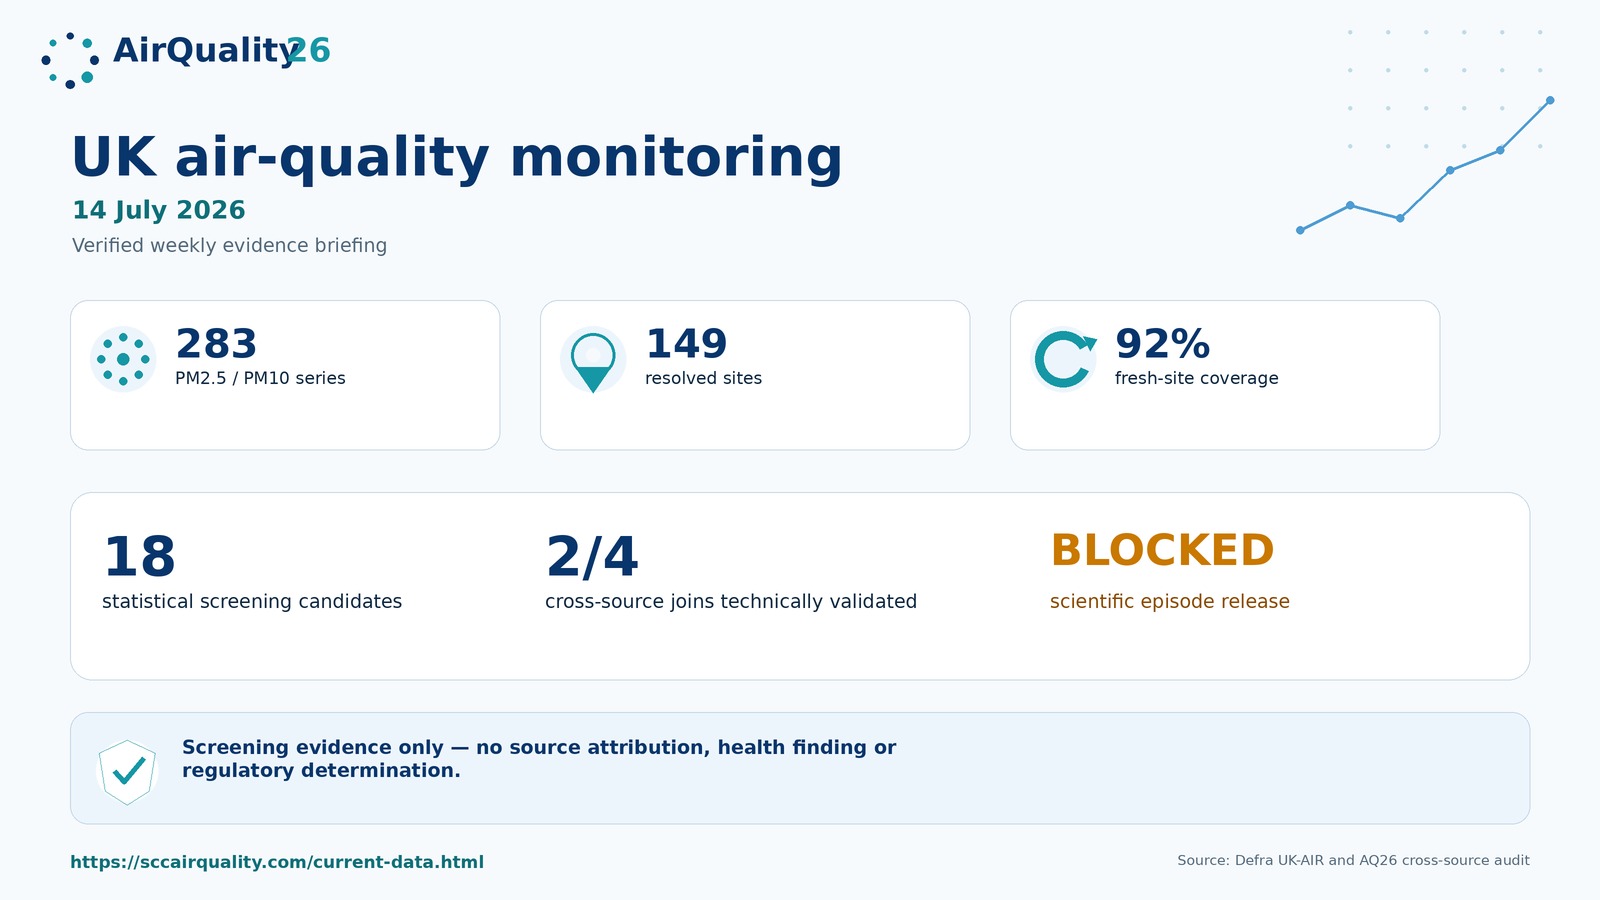
A 16:9 summary prioritising the key coverage metrics, scientific-release status and direct link to the current-data page.
Evidence and publication boundary
Social graphics are generated only after the audited build reconciles with the current monitoring outputs. Public posting is separately gated behind successful live deployment verification and credential checks.
Inspect current status Review publication checks Read methodology
Scientific evidence and software assurance are different
Scientific evidence
Measurements, station and regional coverage, descriptive calculations, source records and stated limitations are the evidence available for review.
Engineering assurance
Automated checks confirm that the pipeline followed its declared rules. They do not constitute peer review, accreditation, regulatory approval or institutional endorsement.
Operational PM2.5 screening interpretation
Adjusted PM2.5 candidate count: 0; eligible station assessments: 123; not eligible or not assessed: 4. A count of zero means only that no eligible assessment crossed every current operational criterion. It does not establish absence of pollution, harmless concentrations, assessment of every station or screening of all pollutants.
Formal false-discovery-rate control has not been established. The live screen does not identify a source and is not a health assessment or regulatory determination.